Application Insights is a real-time logger and analytics service provided as a part of Azure cloud services to track and provide in-depth insights on all the requests and responses which flow to an application deployed in an Azure App Service instance. It is a supplementary service which can be created along with when creating an Azure App Service – which is a "Platform as a Service" model offered by Microsoft Azure for easy application deployments and maintenance. Once linked, the Application Insights takes care of handling and maintaining all the requests and corresponding logs along with telemetry for the applications.
When deploying applications over a cloud based model such as Azure App Services, one common expectation is to have a cloud based logging service that keeps track of the requests, responses and health of the services deployed in cloud. Application Insights is a free offering provided by the Azure for such flexibility and requirements. This service is backed by SDK for various platforms to provide seamless integration and push of logs generated within the application onto the logging service. In our case, lets talk about how we can integrate our ASP.NET Core application (version 3.1 in this example) onto Application Insights for logging.
One thing which makes things easier is that when the application is linked to a particular Application Insights instance, we can hook the application using an instance key called the "Instrumentation Key" available within the created Application Insights instance. The Application Insights framework captures all the logs generated within the application using the ILogger Factory library provided by the ASP.NET Core framework. Which means that, just by using the ILogger framework provided by the ASP.NET Core we can have the logged lines be also pushed and be available over the Application Insights for processing and analysis.
Configuring Application Insights in an Application:
Let’s take the example of our ReadersAPI application which uses the ILogger framework to log various trace and debug logs which occur for any given request and is as below:
namespace ReadersApi.Controllers
{
    [Route("api/[controller]")]
    [ApiController]
    public class ReadersController : ControllerBase
    {
        private readonly ILogger <ReadersController> _logger;
        private readonly IReaderStore _store;

        public ReadersController(ILogger <ReadersController> logger, IReaderStore store)
        {
            _logger = logger;
            _store = store;
        }

        [Route("all")]
        [HttpGet]
        public IEnumerable<Reader> GetReaders()
        {
            _logger.LogInformation("Incoming Request: api/readers/all Method: GetReaders() with no Parameters.");
            _logger.LogInformation(" Calling on the ReaderStore.Readers property");
            var readers = _store.Readers.Where(x => x.Id != 0);
            _logger.LogInformation($"Found {readers.Count()} records. Returning response.");

            return readers;
        }

        [Route("{readerId}")]
        [HttpGet]
        public Reader GetReaders(int readerId)
        {
            _logger.LogInformation($"Incoming Request: api/readers/{readerId} Method: GetReaders() with Parameter {readerId}.");
            _logger.LogInformation(" Calling on the ReaderStore.Readers property");
            var reader = _store.Readers.Where(x => x.Id == readerId).FirstOrDefault();

            if (reader != null)
            {
                _logger.LogInformation($"Found a reader. Returning response.");
            }

            return reader;
        }
    }
}
We can observe that the trace logs are written for every method definition using the logger variable which is of type ILogger
namespace dotnetcore3app
{
    public class Startup
    {
        public Startup(IConfiguration configuration)
        {
            Configuration = configuration;
        }

        public IConfiguration Configuration { get; }

        public void ConfigureServices(IServiceCollection services)
        {

            services.AddLogging(options =>
            {
                options.AddConsole();
		options.SetMinimumLevel(LogLevel.Trace);
            });

            services.AddScoped<IReaderStore, ReaderStore>();

	    ....
    }

	...
    }
}
And when this code is executed for the API /api/readers/all , we get the below logs under the console (ignoring the other logs):
info: dotnetcore3app.Store.ReaderStore[0]
      Seeded ReaderStore with 2 users and 2 readers.
info: ReadersApi.Controllers.ReadersController[0]
      Incoming Request: api/readers/all Method: GetReaders() with no Parameters.
info: ReadersApi.Controllers.ReadersController[0]
       Calling on the ReaderStore.Readers property
info: ReadersApi.Controllers.ReadersController[0]
      Found 2 records. Returning response.
Now that we’ve confirmed that our logging system is working fine for the API, let’s link this application to an Application Insights instance for pushing logs onto the Application Insights engine. This is done by adding a section under the appsettings.json above the default "Logging" section as below:
{
  "ApplicationInsights": {
    "InstrumentationKey": "xxxxxxxx-xxxx-xxxx-xxxx-xxxxxxxxxxxx"
  },
  "Logging": {
    "LogLevel": {
      "Default": "Debug",
      "System": "Information",
      "Microsoft": "Information"
    }
  },
  "AllowedHosts": "*"
}
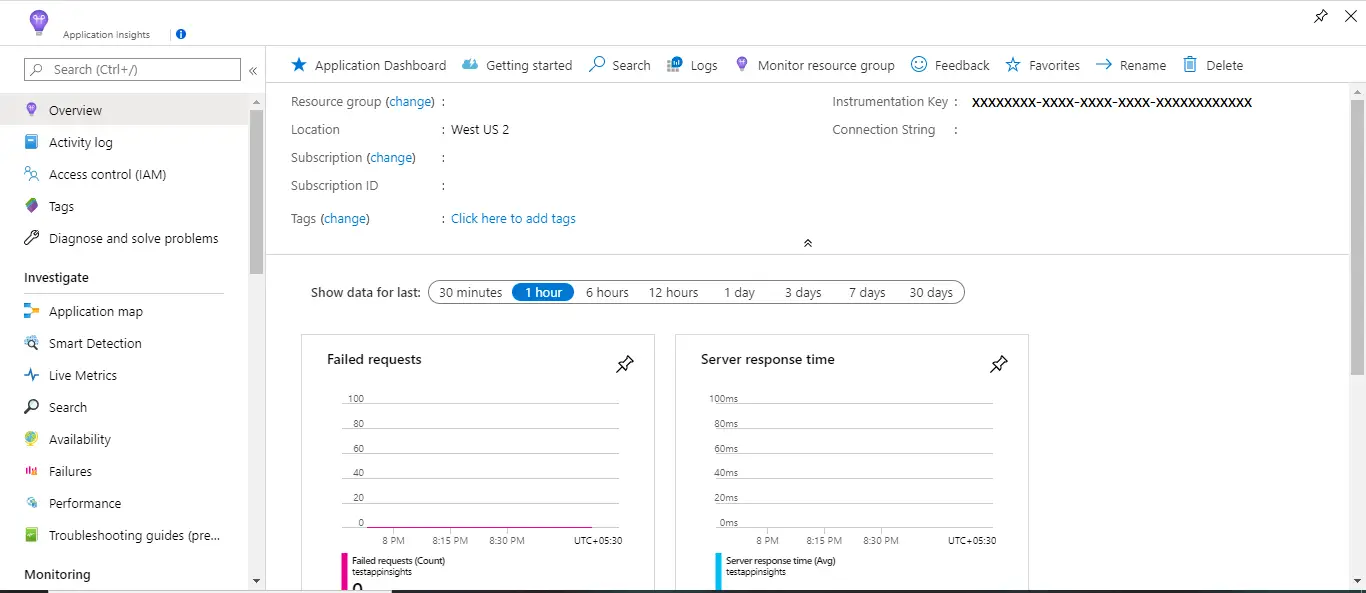
The InstrumentationKey is a GUID sort of key, which is generated and is available under the Application Insights instance in the Azure portal. When we add this segment to our application and run this application with the necessary libraries of Application Insights SDK in place, all these logs which we saw earlier will be pushed to the Application Insights instance tagged to this instrumentation key and we can be able to analyse a better deal of information than the ones we generally obtain in a normal console.
Next, we add the Application Insights library to our API project using the below command:
> dotnet add package Microsoft.Extensions.Logging.ApplicationInsights
This nuget package contains the library which can be used to further sophisticate and customize on what data is being pushed to the Application Insights for processing. It also contains the necessary hooks which we shall add in the next step for us to be able to push data to the Application Insights instance.
Finally, we hook the ILogger logging framework calls to push the logged context into Application Insights by changing the AddLogging() method call under the Startup.ConfigureServices as below:
services.AddLogging(options =>
{
	// hook the Console Log Provider
	options.AddConsole();
	options.SetMinimumLevel(LogLevel.Trace);

	// hook the Application Insights Provider
	options.AddFilter<ApplicationInsightsLoggerProvider>("", LogLevel.Trace);

	// pass the InstrumentationKey provided under the appsettings
	options.AddApplicationInsights(Configuration["ApplicationInsights:InstrumentationKey"]);
});
Now that we are done, let’s run our application and see if the logs appear under the ApplicationInsights instance which is tagged to the instrumentation key we have provided in the appsettings.json file.
When we run this application and hit the API /api/readers/all for response and observe the traces which are logged under the Application Insights search section, we can see the below entries of information.
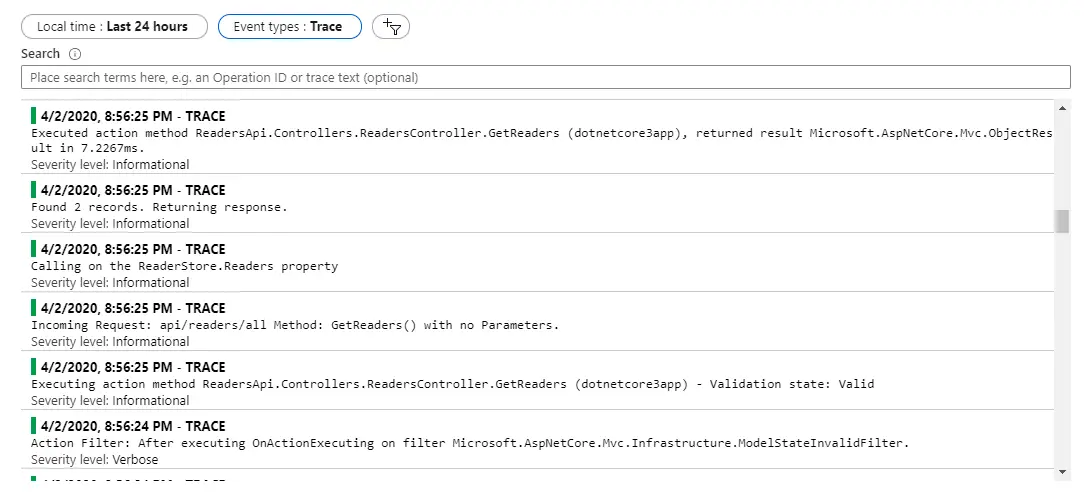
This way we can push our already implemented Logger system onto the Application Insights engine for processing via the Application Insights SDK and ILogger.

Found this article helpful? Please consider supporting!